When Progress Goes Quiet, Your Training Log Speaks Volumes
Nothing beats the unmistakable physical sensation that you are stronger than you were yesterday. But how do you stay motivated when you can't feel it?


Last weekend, it finally happened. I worked out on a Saturday morning—not because I wanted to, and not because I usually train then.
I trained because a number I track was low, and I wanted to see it go up.
How I got here
I've been strength training for ten years, through several seasons of life and varying degrees of motivation. There have been stretches where motivation came easily—notably during my novice phase when the numbers only went up. Nothing beats the unmistakable physical sensation that you are stronger than you were yesterday.
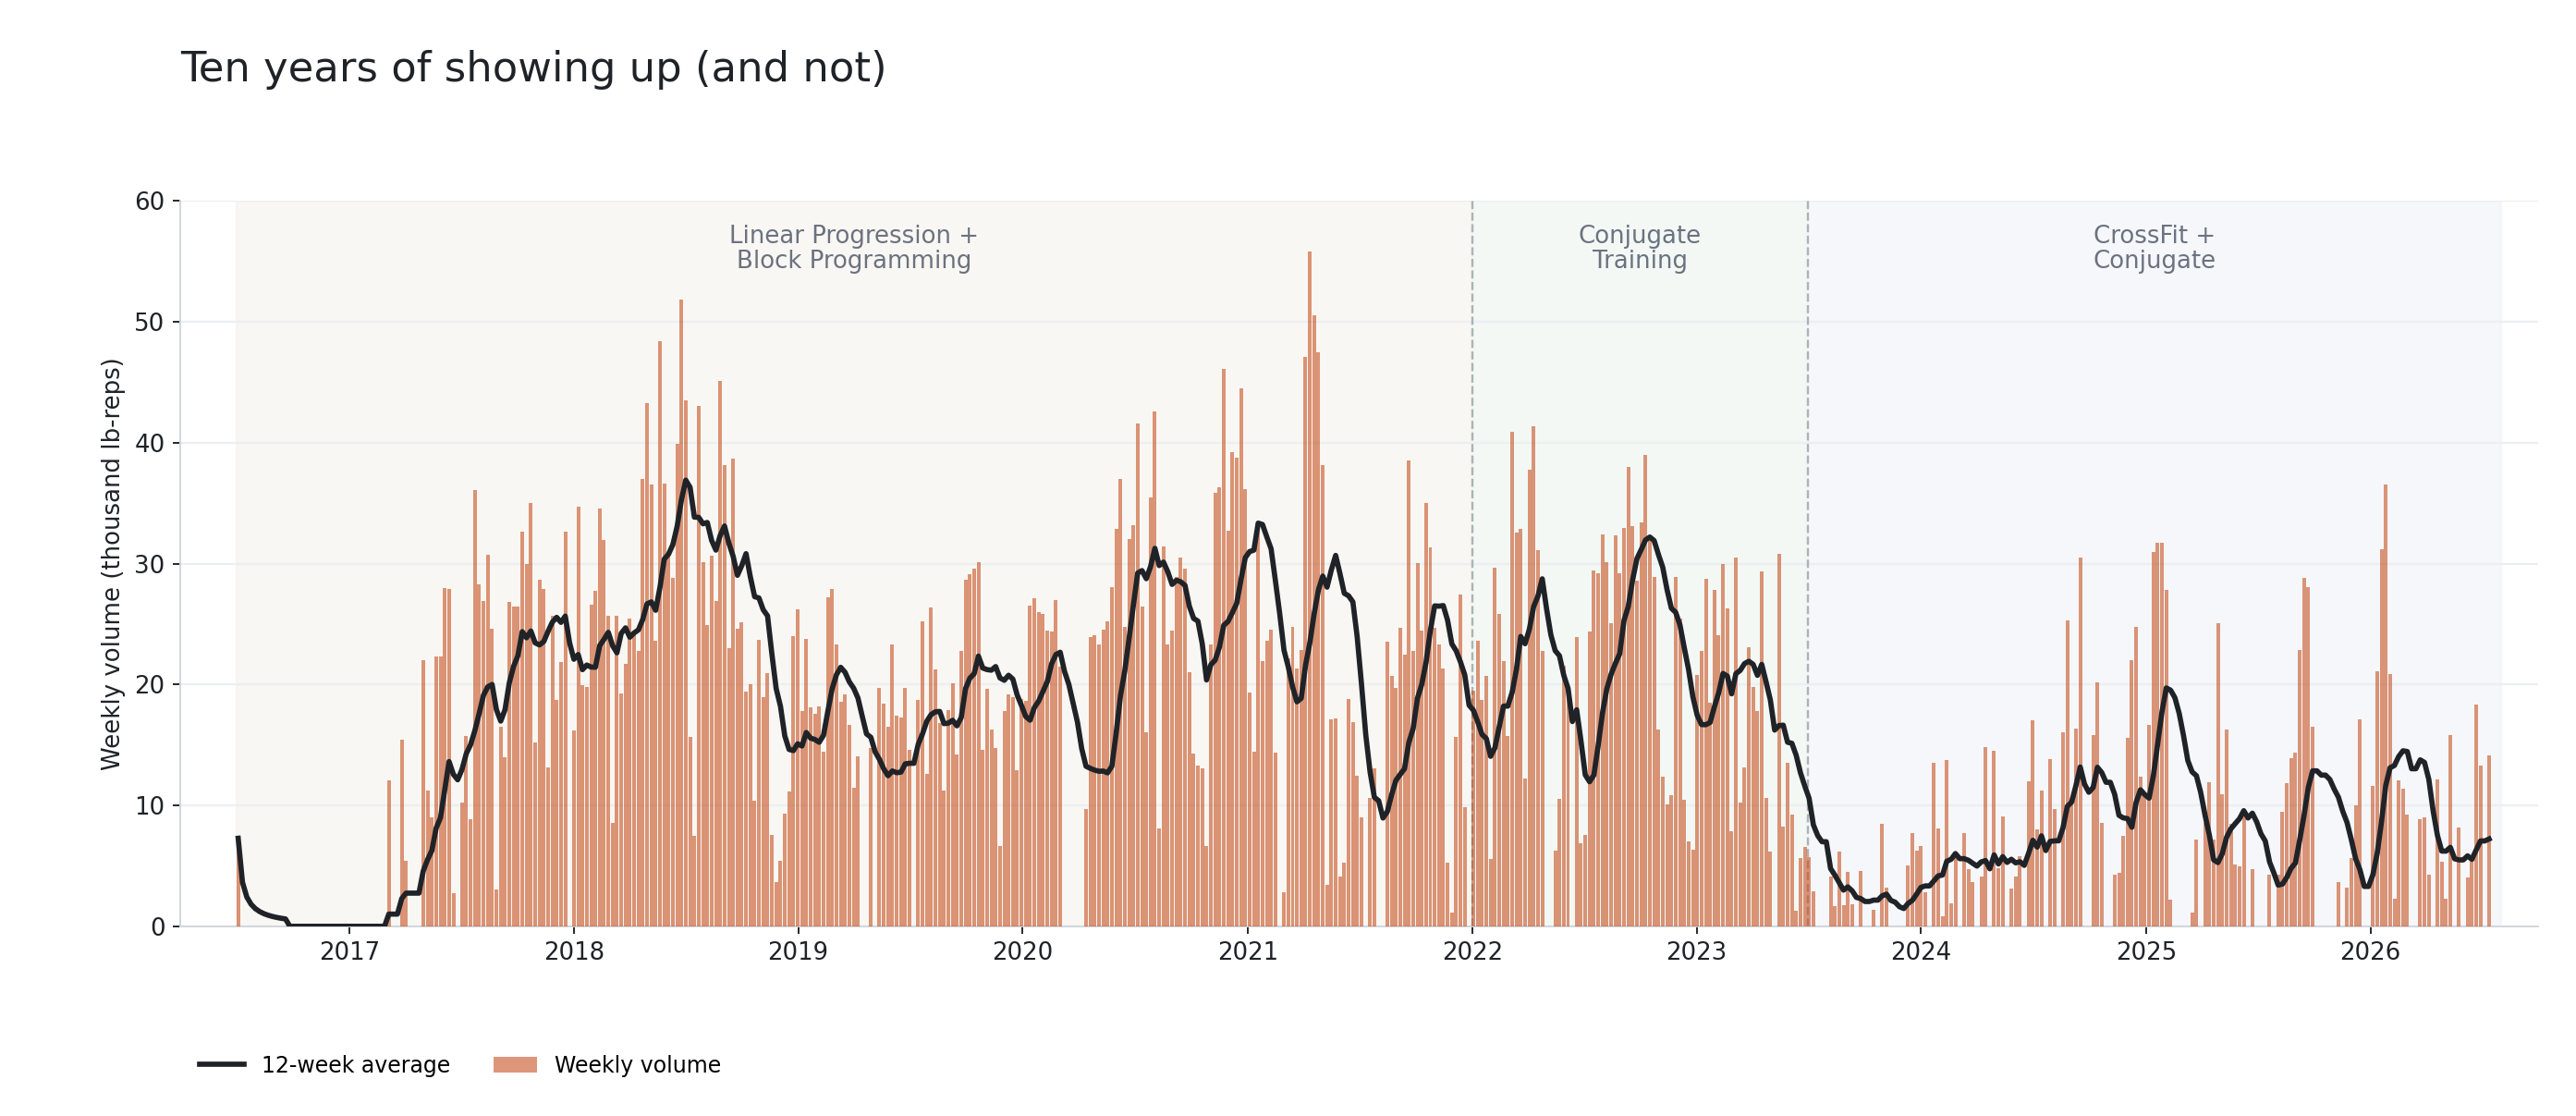
But there were many times when it was harder to feel that feeling. Training advances, programming complexity increases, and progress inevitably slows. The longer you train, the harder it becomes to connect what you put in (your training) to what you get out (your strength).
When I started following Andy Baker's conjugate programming, I would often skip the programmed accessory work. But in the back of my mind I was wondering how did skipping accessories affect my progress?
When I joined CrossFit, it was no longer feasible to strength train four days a week. But how often should I train? Without the defined structure of a specific "N days per week" program, I struggled to stay consistent. In this case, I knew I was losing strength. But I wondered what "dose" of strength training could at least help me maintain?
In search of signal
Broadly speaking there were two questions I was asking:
- How does a particular training session contribute to my strength?
- How does strength deteriorate when training is skipped or shortened?
Even if I couldn't precisely answer these questions, I knew any visibility would provide that little bit of extrinsic motivation that could occasionally be the difference between training or not—on a Saturday morning, for example.
These questions are what led me to start computing a number I call Impulse.
Borrowing a fifty-year-old model
The name comes from an "impulse response" model (also referred to as a Fitness-Fatigue model) developed in the 1970s by Eric Banister and colleagues.
The idea behind the model is pretty simple. A "dose" of training (the impulse) does two things at once: It creates short-term fatigue (you get tired) and it builds longer-term fitness (you improve). The key is that fitness sticks around longer than fatigue, so as volume accumulates, the trainee holds on to relatively more fitness. This difference (fitness minus fatigue) is referred to as performance.
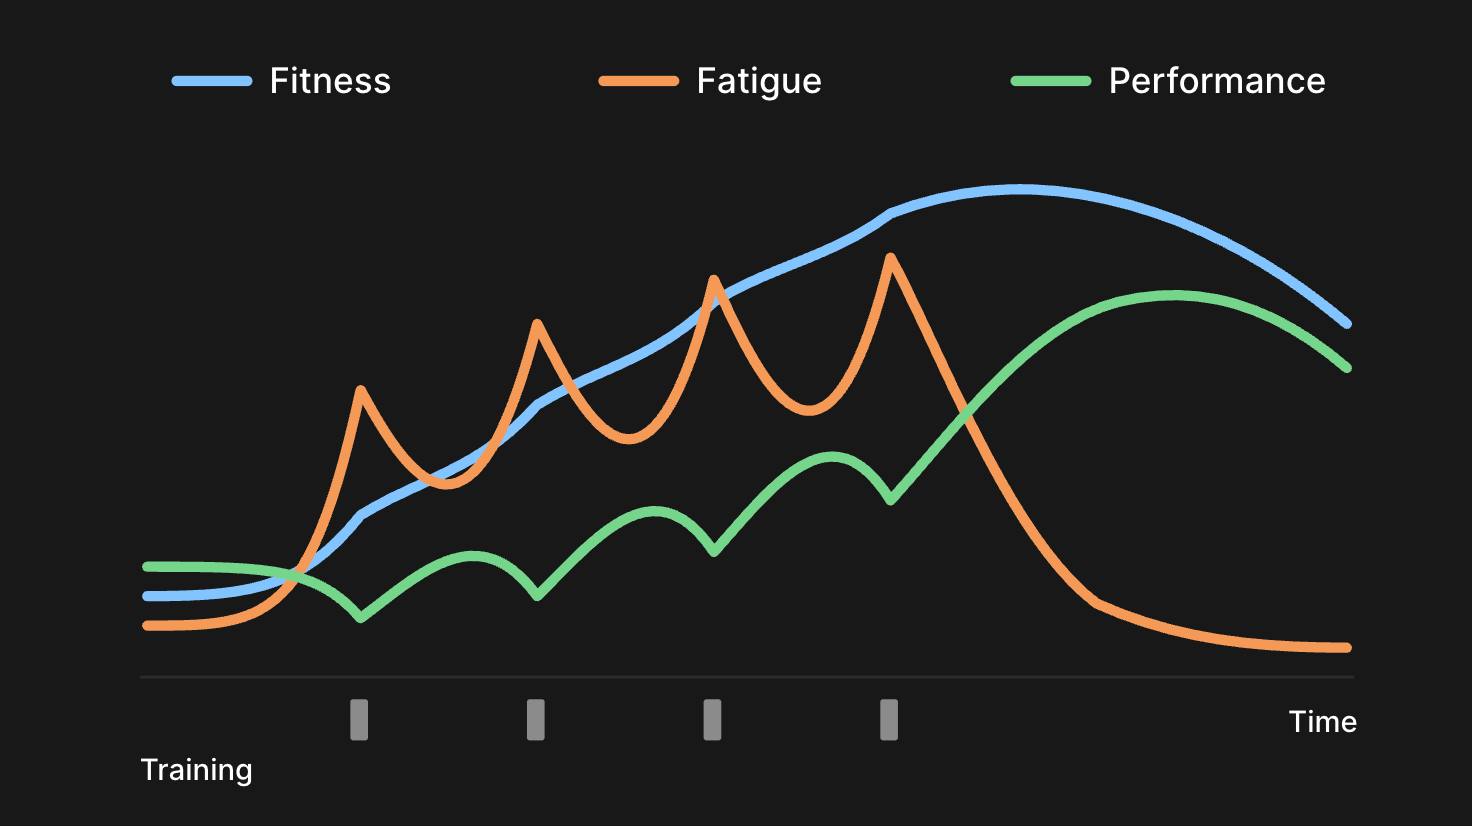
A single dose of training raises both fitness and fatigue. Fatigue clears quickly, fitness fades slowly, and performance is the gap between them.
The model has most often been used in endurance sports. Running, cycling, and swimming all produce the kind of regular training data the model needs. (I'm not the first person to apply this kind of model to lifting. In 2014, coach and sports scientist Mladen Jovanović used his own squat and bench data to test several ways of representing strength-training load.) But strength training is a little messier.
Strength is specific
A cyclist can reasonably model their training as targeting a single performance category. Rides may vary in length and intensity, but they all contribute to the same basic ability: Producing power on a bike. Strength training is different. Training your squat tends to make you specifically better at squatting.
So Impulse needs to separate strength into categories. I chose to organize exercises by their relationship to competition lifts (for now, Squat, Bench Press, Deadlift and Standing Overhead Press). Each category also includes related supplemental lifts: the Squat category, for example, encompasses the Box Squat, Safety Bar Squat, and Paused Squat.
Each working set creates a dose based on a lift's intensity and volume. That dose is then assigned to the kind of strength the exercise is expected to build.
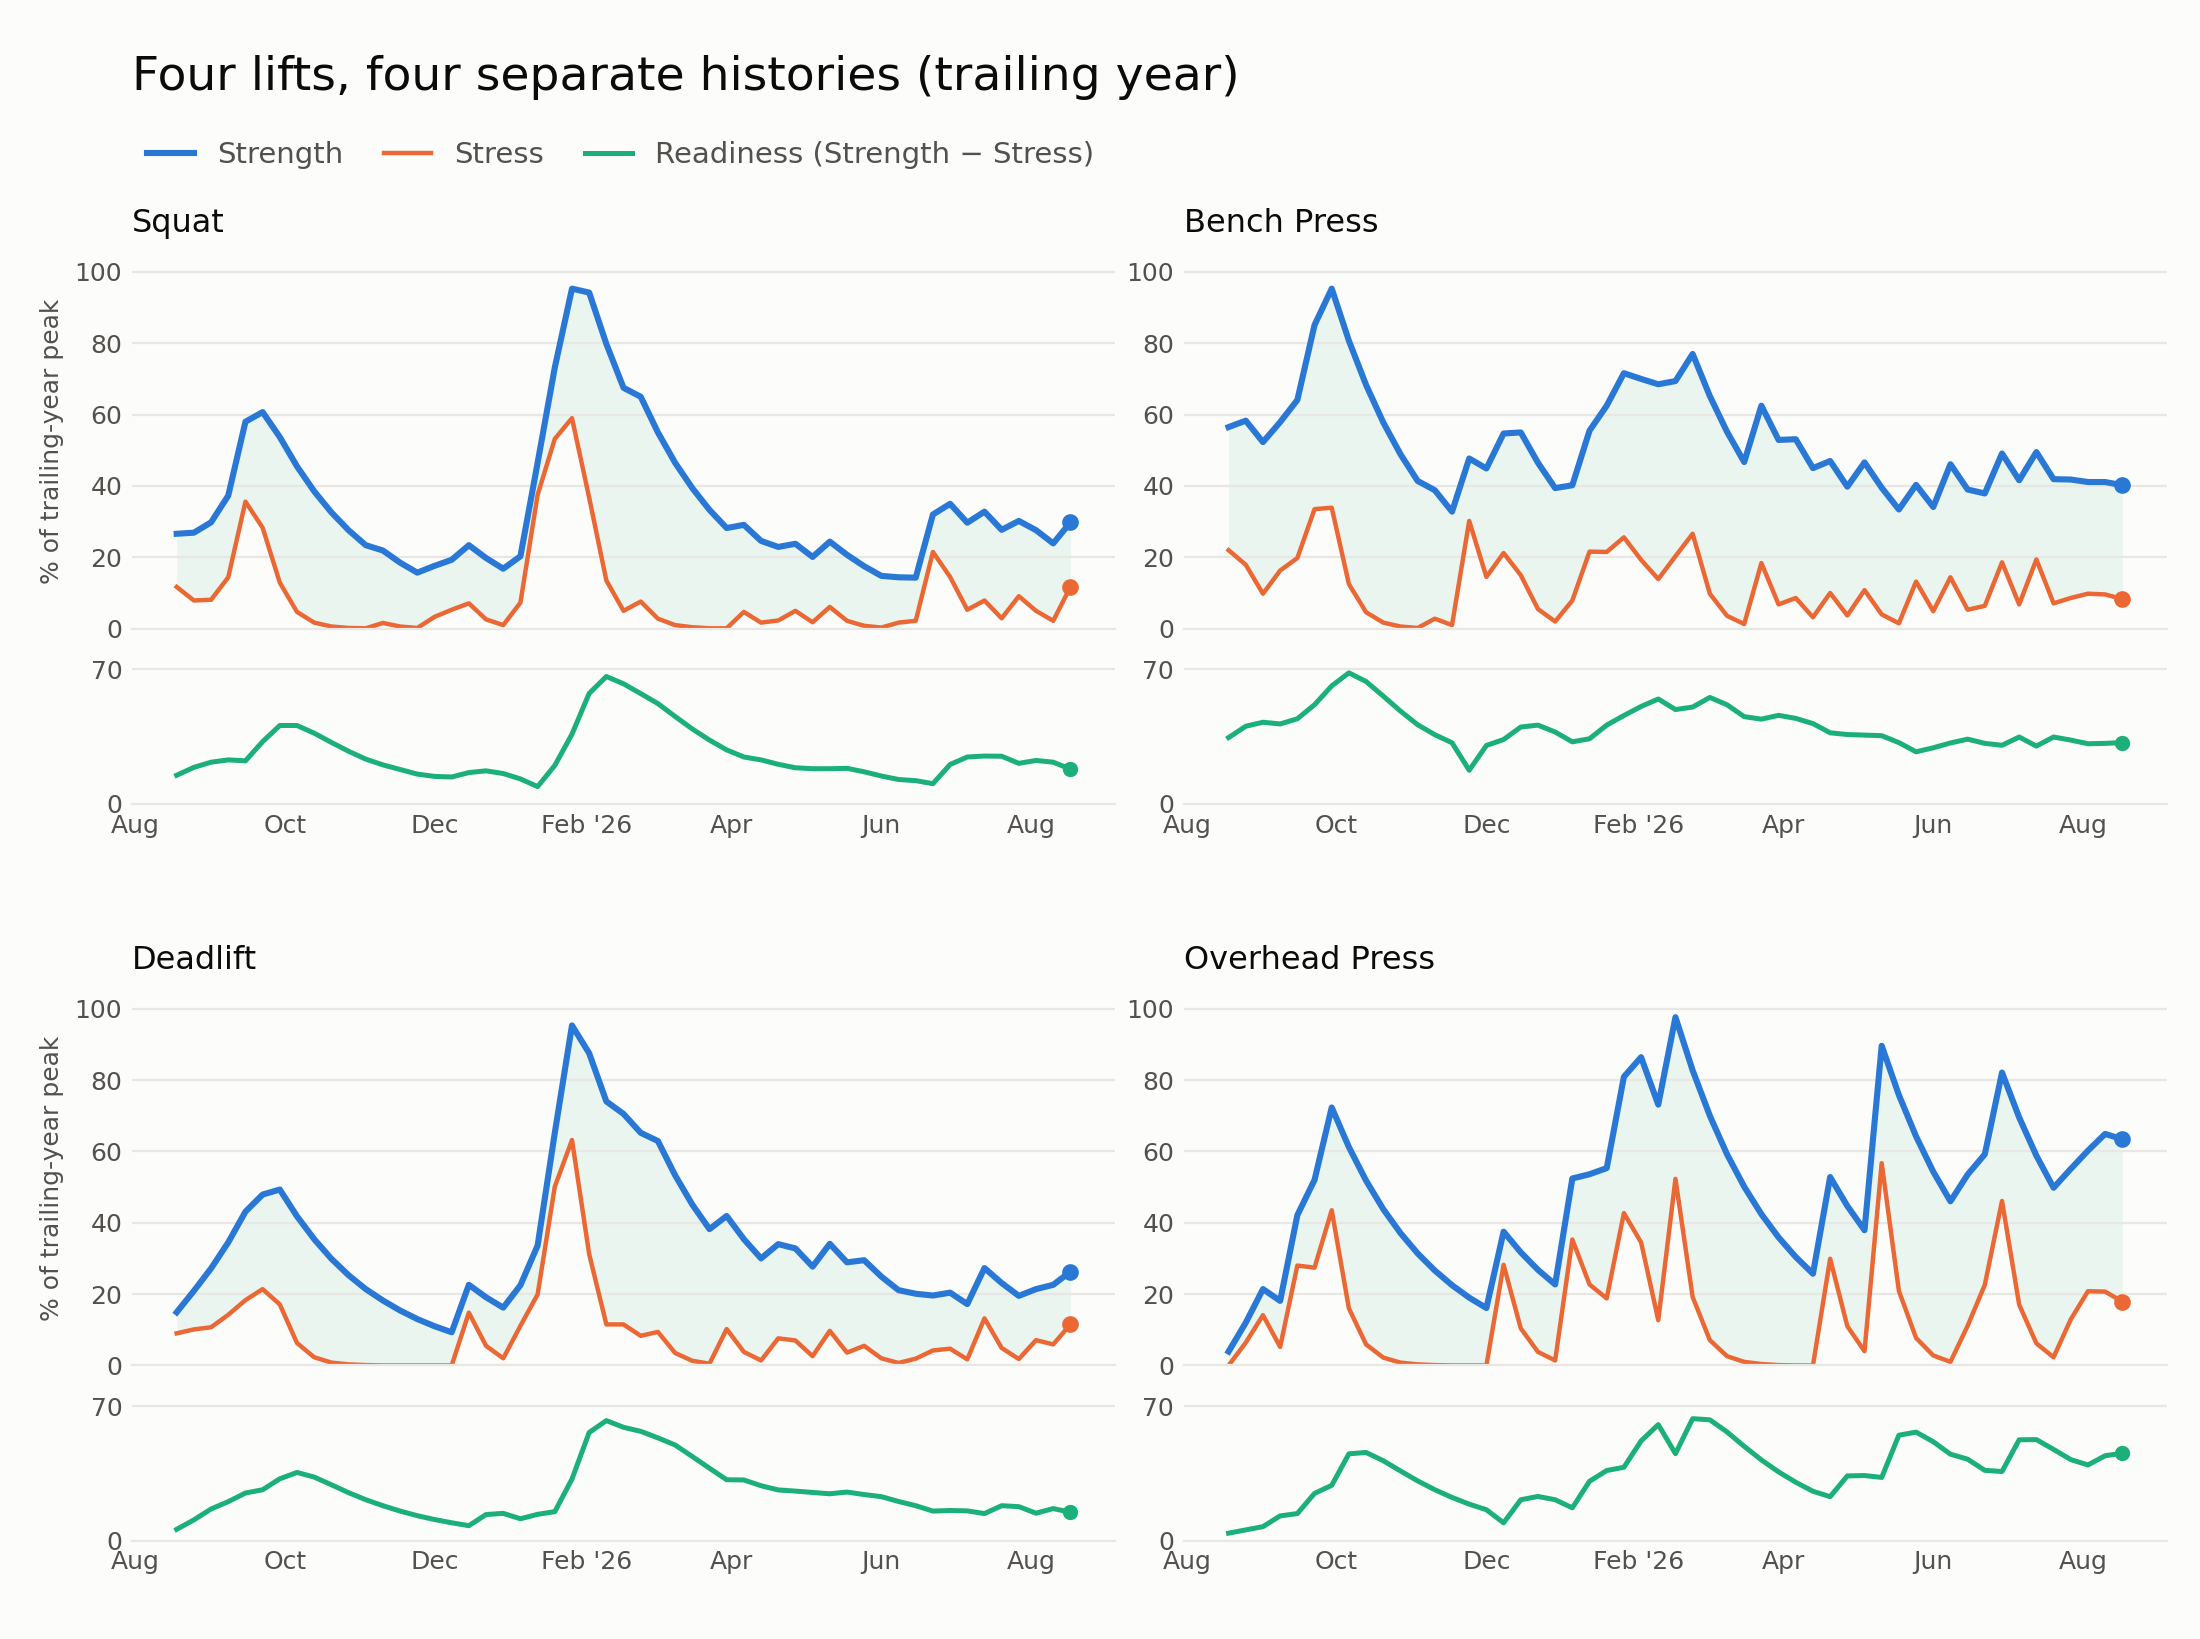
Impulse tracks the training state of each major lift separately. Lately, my bench press and deadlift had been sliding.
A hard stretch of training increases what I call Strength (the original model's Fitness) and Stress (Fatigue). The difference between them is Readiness. Stop training for long enough and Stress disappears, but eventually Strength starts falling with it.
I do not think this number tells you exactly what you will lift today. It does not know how you slept, what you ate, whether your knee hurts, or whether you actually feel like training. It is not a coach, and it is not a prediction of your next max.
But it does something I haven't found anywhere else: It makes the slow accumulation of training load legible to the lifter.
What does my historical data say?
I also wanted to know whether this was anything more than a nice-looking graph. I had about ten years of training data, so I tested whether Readiness—the gap between Strength and Stress—was higher before days when I set personal records. It was. The day before a PR looked meaningfully different from an ordinary training day, and the pattern held across all four lifts I studied.
That does not prove the model can predict a PR. But it suggests that the number is picking up something real about the state created by training and recovery. I will get into that research, and the places where the model works less well, in the rest of this series.
For now, the simpler result is the one this post started with. Last Saturday the number was low, and I wanted to see it go up. So I trained, on a morning I otherwise wouldn't have. That is exactly what I want from all of this data: it makes me want to work out.